Order Management
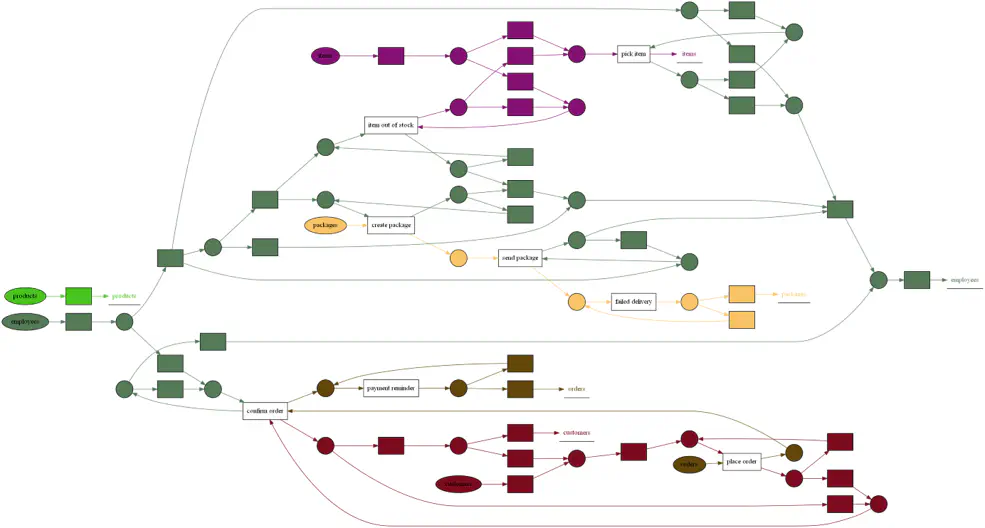
This site describes a pipeline to conduct event data simulation and process analysis on an artificial order management process, as depicted in the figure below.
All artifacts used in the following (CPN, event log) of the exemplary process and a detailed description of the process itself can be found at this page.
Running the Simulation Model
These are instructions on how to run a simulation model to create event data. If you wish to directly start with a ready-made event log, skip this point and continue with “Analyzing the Event Log” using the event log linked above.
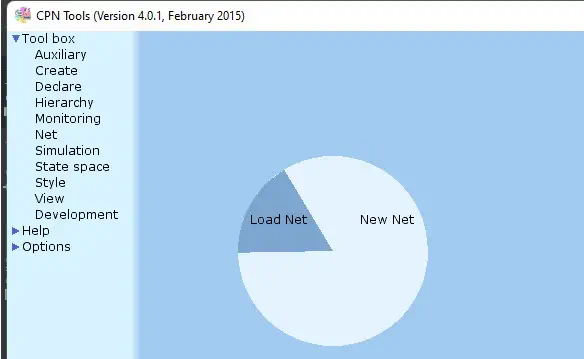
To run the simulation model, download and install CPN Tools. After starting CPN tools, open the CPN by holding down the right mouse key in the tool work space and selecting “Load Net”.

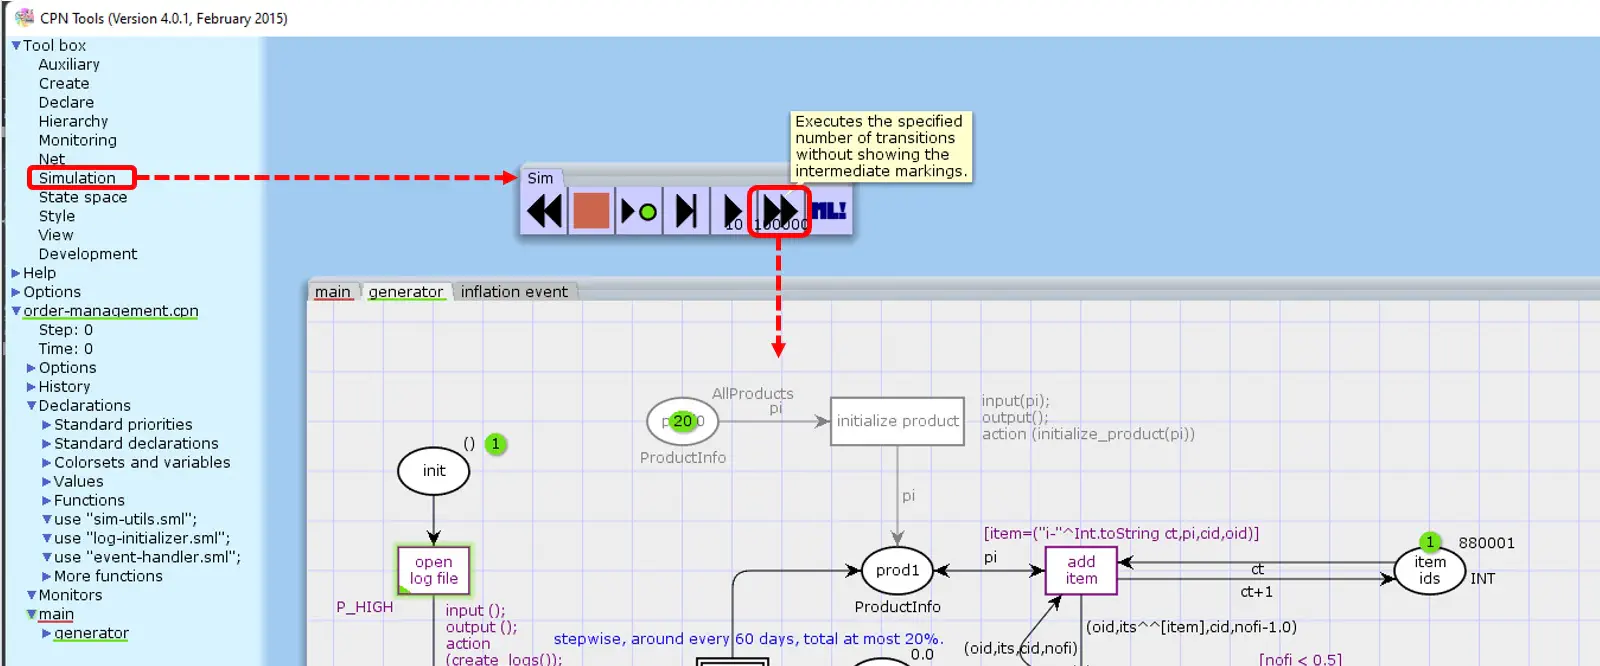
After opening the net, drag and drop the “Simulation” tools from the tool box to the work space. To run the simulation, pick the fast-forward tool as indicated below, and click inside the CPN panel to execute the specified number of steps in a fast-forward way; around 50.000 steps are necessary to complete the whole simulation. This may take a minute.

The simulation creates a set of CSV files that correspond to OCEL2.0 tables. Run this Python notebook within the directory where the CSV files reside to convert them to an SQLite file.
Feel free to adapt the parameters of the simulation model. For instructions on how to use CPN tools, we refer to the website linked above.
Analyzing the Event Log
You can use the resulting sqlite file (which you can also download directly from zenodo) to get an overview over your data. All of the tools give you a general overview of the event log, by providing the number of events, objects, activities and object types. The order management log contains:
| Property | Value |
|---|---|
| Event Types | 11 |
| Object Types | 6 |
| Events | 21008 |
| Objects | 10840 |
However, the variety of tools provide a broad spectrum for event log analysis: Ocelot allows browsing through the log data, presenting the individual objects and events the different types and their attributes. By uploading your data to OCPM the data can be visualised in pie-charts or dotted-charts as well as offering general object-centric process mining techniques such as discovery and conformance checking. The best tool to view process variants remains OCpi OCpi, now supporting OCEL 2.0. The python libraries pm4py and ocpa allow the integration of object-centric process mining into individual data analyses and tools. Where pm4py is an all-rounder when it comes to process mining, also supporting traditional process mining techniques, ocpm focusses on object-centric process mining, providing insights on process performance.
Gaining Process Insights
When analysing the example log, we can view the object-centric Petri net using one of the tools, as depicted below.
The different colors clearly show the interactions among the different object types.

Apart from the process knowledge that could already be gained using the former ocel standard, some additional insights can be gained with OCEL 2.0: A customer has an assigned primary sales representative and a secondary representative that should take over in case the primary representative is unavailable. By making use of the object-to-tobject relationship, it is now possible to assess compliance to such a rule. The figure below shows a compliance of 97.3%.
When sending a package, the employee object assigned under the role “forwarder” needs to have a qualification to do so, i.e., needs to have a warehousing license. The event to object qualifier the detection of such liability issues:
The dynamic object attributes also enable considerations of attributes values over time, as well as dependencies between the control flow and certain attribute values within the same object type. In the order management example, we see that the price of products rises due to inflation:
The new standard clearly offer ground for the automated detection of new process insights.


